The Coronavirus (COVID-19) pandemic is exacerbating the health disparities among people of color and other medically vulnerable populations due to longstanding social, economic, and health care inequities and structural racism nationwide. The first peer-reviewed journal publication on racial/ethnic COVID-19 disparities in CT highlights how Black residents have disproportionately higher rates of COVID-19 related mortality.
UConn HDI shares resources as part of the second annual Health Equity Week, to raise awareness and a call to action for consistent collection and public reporting of race, ethnicity, and language data for COVID-19 testing, cases, hospitalizations, and deaths in the nation and in Connecticut.
The U.S. Centers for Disease Control is reporting cases of Coronavirus Disease (COVID-19) in the U.S. by race and ethnicity. Disaggregated data by race and ethnicity provides a mechanism to identify patterns of disproportionate disease incidence and mortality rates. Using this information helps organizations, advocates, decision-makers, and researchers address unmet needs in specific communities.
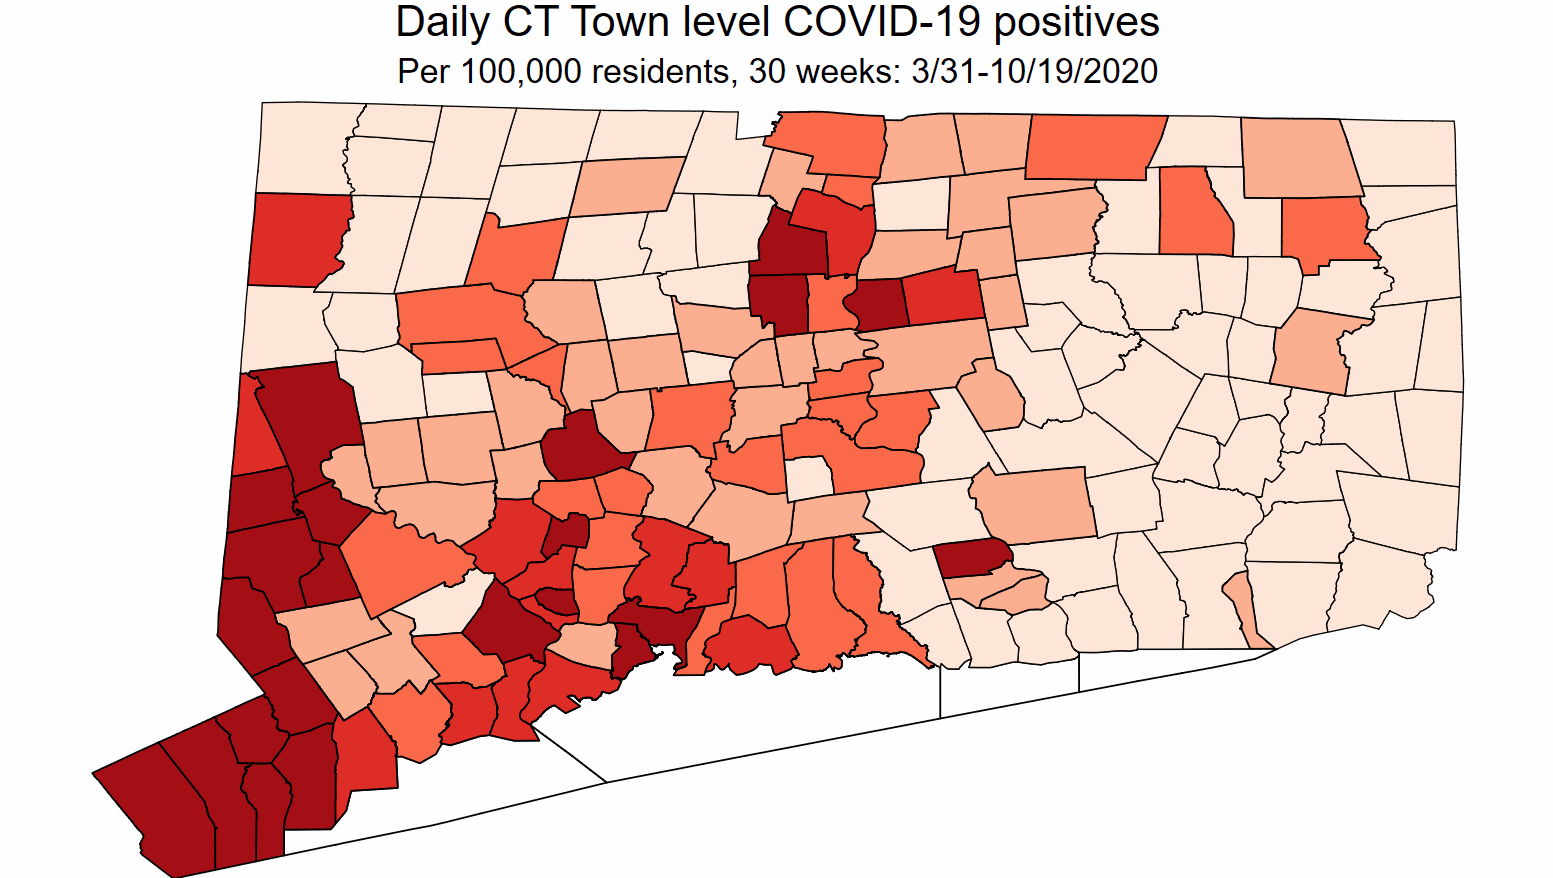
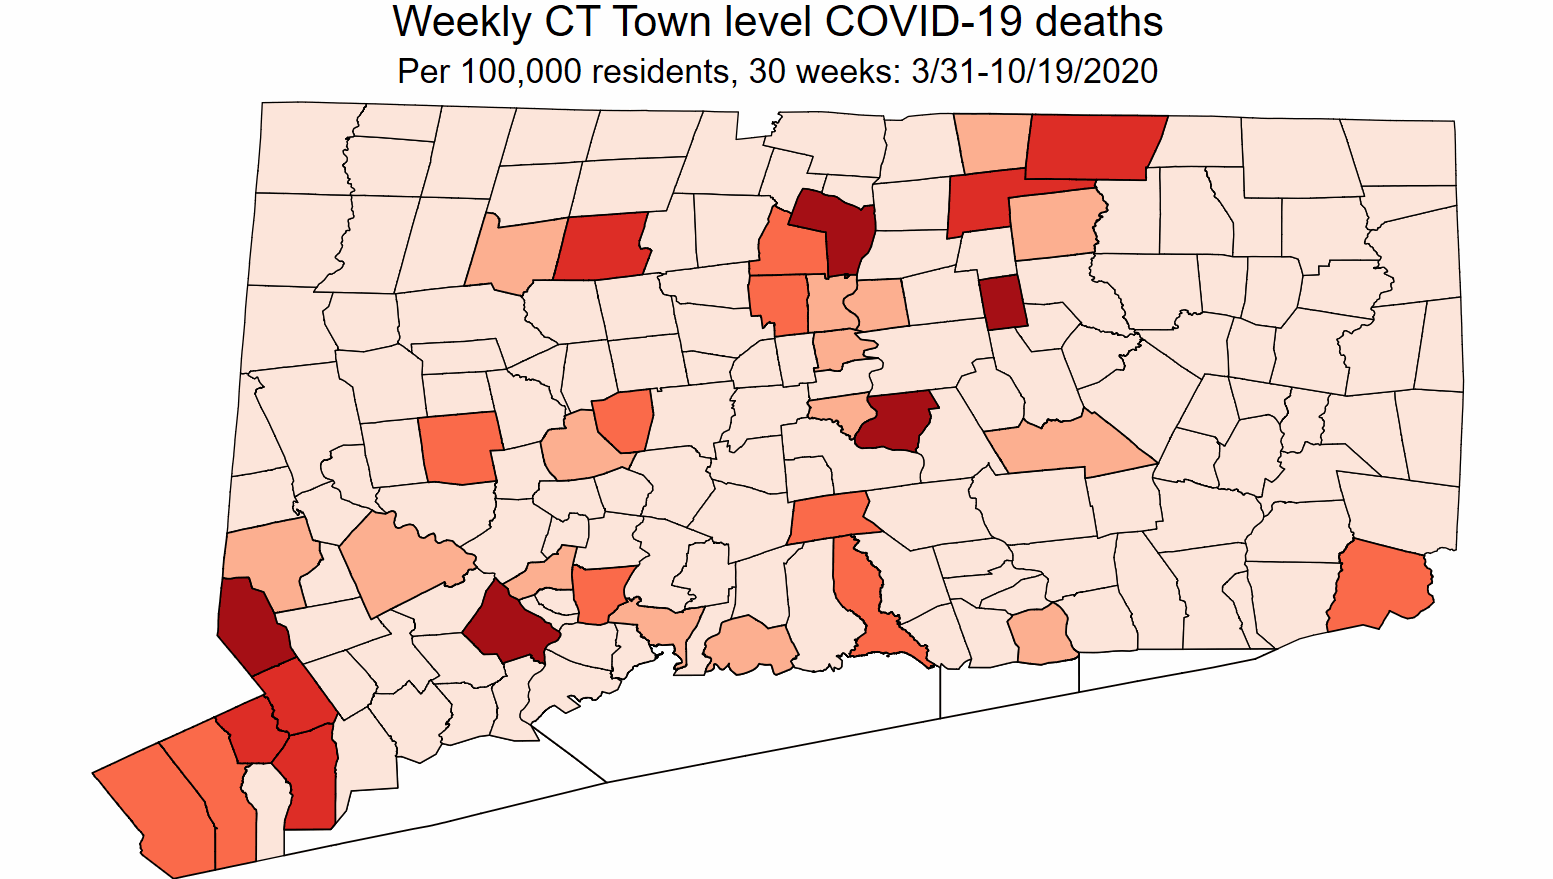
In Connecticut we build on existing analysis on rates of health disparities and are tracking Connecticut cases of infection and mortality rates by race/ethnicity and gender in our COVID-19 CT Dashboard. In CT, we are finding greater magnitude of health disparities in COVID-19 infection and mortality among Black/African American and Hispanic/Latinx populations compared to their white counterparts.
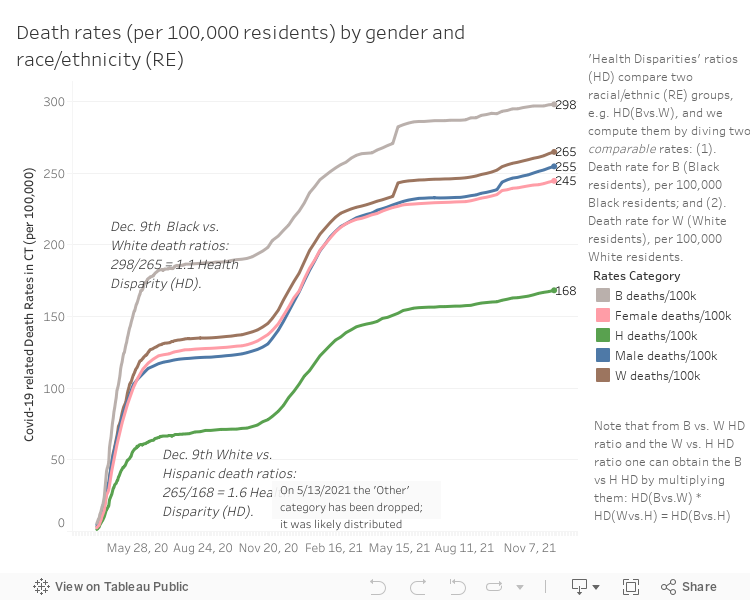
Death Rates by gender and race/ethnicity (per 100,000 residents)
As we continue to provide on-going updates, centering health equity in our statewide COVID-19 response and recovery is critical. This translates to a fair allocation of resources where they are most needed, and furthers policy to remedy unequal systems. Without these data, we cannot thoughtfully design policy to prevent inequities, or evaluate how COVID-19 is affecting people of color.
We thank every individual and organization that has provided input thus far. For more information, thoughts, or questions, please contact Emil Coman, PhD, PSTAT. To collaborate in generating solutions, please contact Projects Manager, Valen Diaz, MPH, MCHES.
Methodology
We compute rates by dividing raw counts (numerator, e.g. deaths of CT males, multiplied by 100,000) by the male population totals (denominator, e.g. total CT male residents).
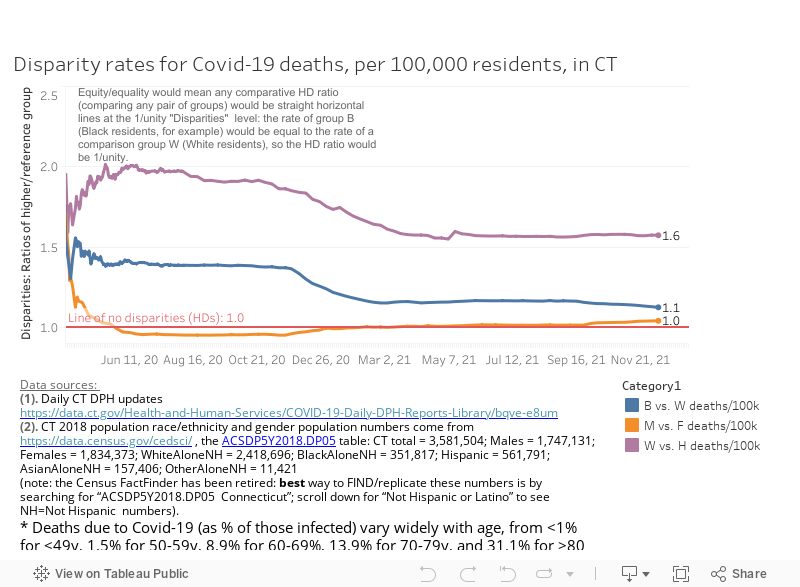
The health disparity rate (HD) means how many more times individuals in a R/E group or gender group experience worse outcome than those in the R/E reference group. In most cases, the reference group is the R/E group with the best health outcome. For example, a rate of 1 means that the comparison group and the reference group exhibit equal rates for the health equity indicator (no Health Disparities – no HDs). Similarly, a rate of 1.5 (or higher) means that the comparison groups exhibit a rate that is one and a half times (or more) larger than the reference group. A rate of 2 or more means that the reference group exhibits a rate that is at least twice that of the reference group (severe HDs).