Accepting students for Lab Rotations
Weekly lab meetings are on Fridays, starting at 3 pm, in the conference room L4009
Rotation projects revolve around fundamental questions in neuronal development and regeneration in the CNS. We integrate cutting edge molecular, biochemical, genetic, bioinformatics, and translational approaches. Due to the proprietary nature of the research projects in our lab, detailed information about the research program and rotation projects for Ph.D. students is not available publicly. If you are interested in neuroregeneration research, please schedule an appointment with Dr. Trakhtenberg to learn more about open rotation projects. Rotation projects involve the following techniques:
HISTOLOGY AND NEUROANATOMICAL ANALYSIS USING CONFOCAL MICROSCOPY
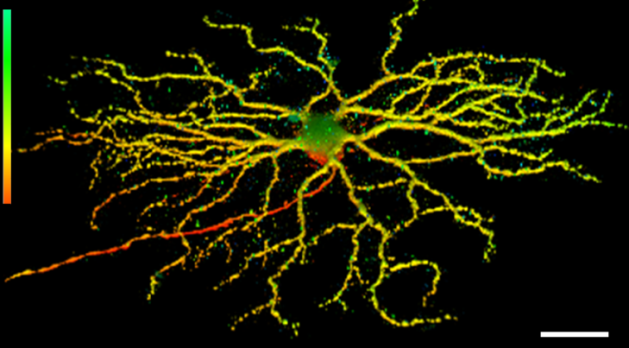
Representative 3D image of retinal ganglion cell dendritic arborization in mouse retina from the Thy1-YFP H-strain. The depth is color-coded (bar on the left): Axon is red, the medium depth dendrites are yellow, and those reaching deeper towards the inner plexiform layer are green. Scale bar, 100 µm (Trakhtenberg et al., 2016. Developmental Neurobiology).
RODENT CNS IN VIVO INJURY MODELS AND GENE THERAPY
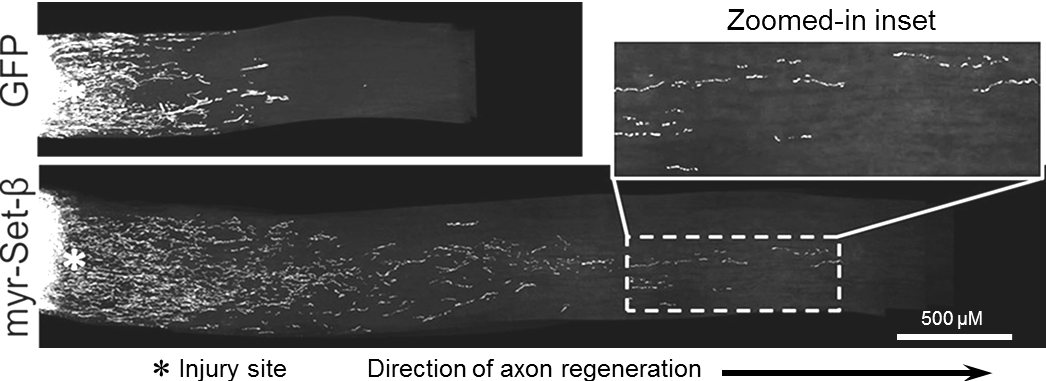
Axon regeneration in vivo after optic nerve injury by myr-Set-β AAV2 gene therapy. Representative image of longitudinal optic nerve section 2 weeks after injury, treated with intraocular AAV2 gene therapy for myr-Set-β. The regenerating axons visualized using an anterograde CTB dye (Trakhtenberg et al., 2014. Journal of Neuroscience).
NEURONAL CELL CULTURE AND TRANSFECTION

Representative images of primary rat CNS neurons, postnatal retinal ganglion cell neurons (A) and embryonic hippocampal neurons (B), transfected with transgene-encoding plasmids and cultured in vitro. In both types of neurons Set-β localized to the nucleus and suppressed axon growth, whereas myr-Set-β localized to the cytoplasm/neurites and promoted axon growth, after transfection with tagged constructs expressing these transgenes or mCherry control. Immunostained for the tags (red), Tuj1 (labels axons), and DAPI (outlined nucleus). Scale bars: 20 µm left, 500 µm right in A and B (Trakhtenberg et al., 2014. Journal of Neuroscience).
NEXT GENERATION SEQUENCING AND NEURO-BIOINFORMATICS
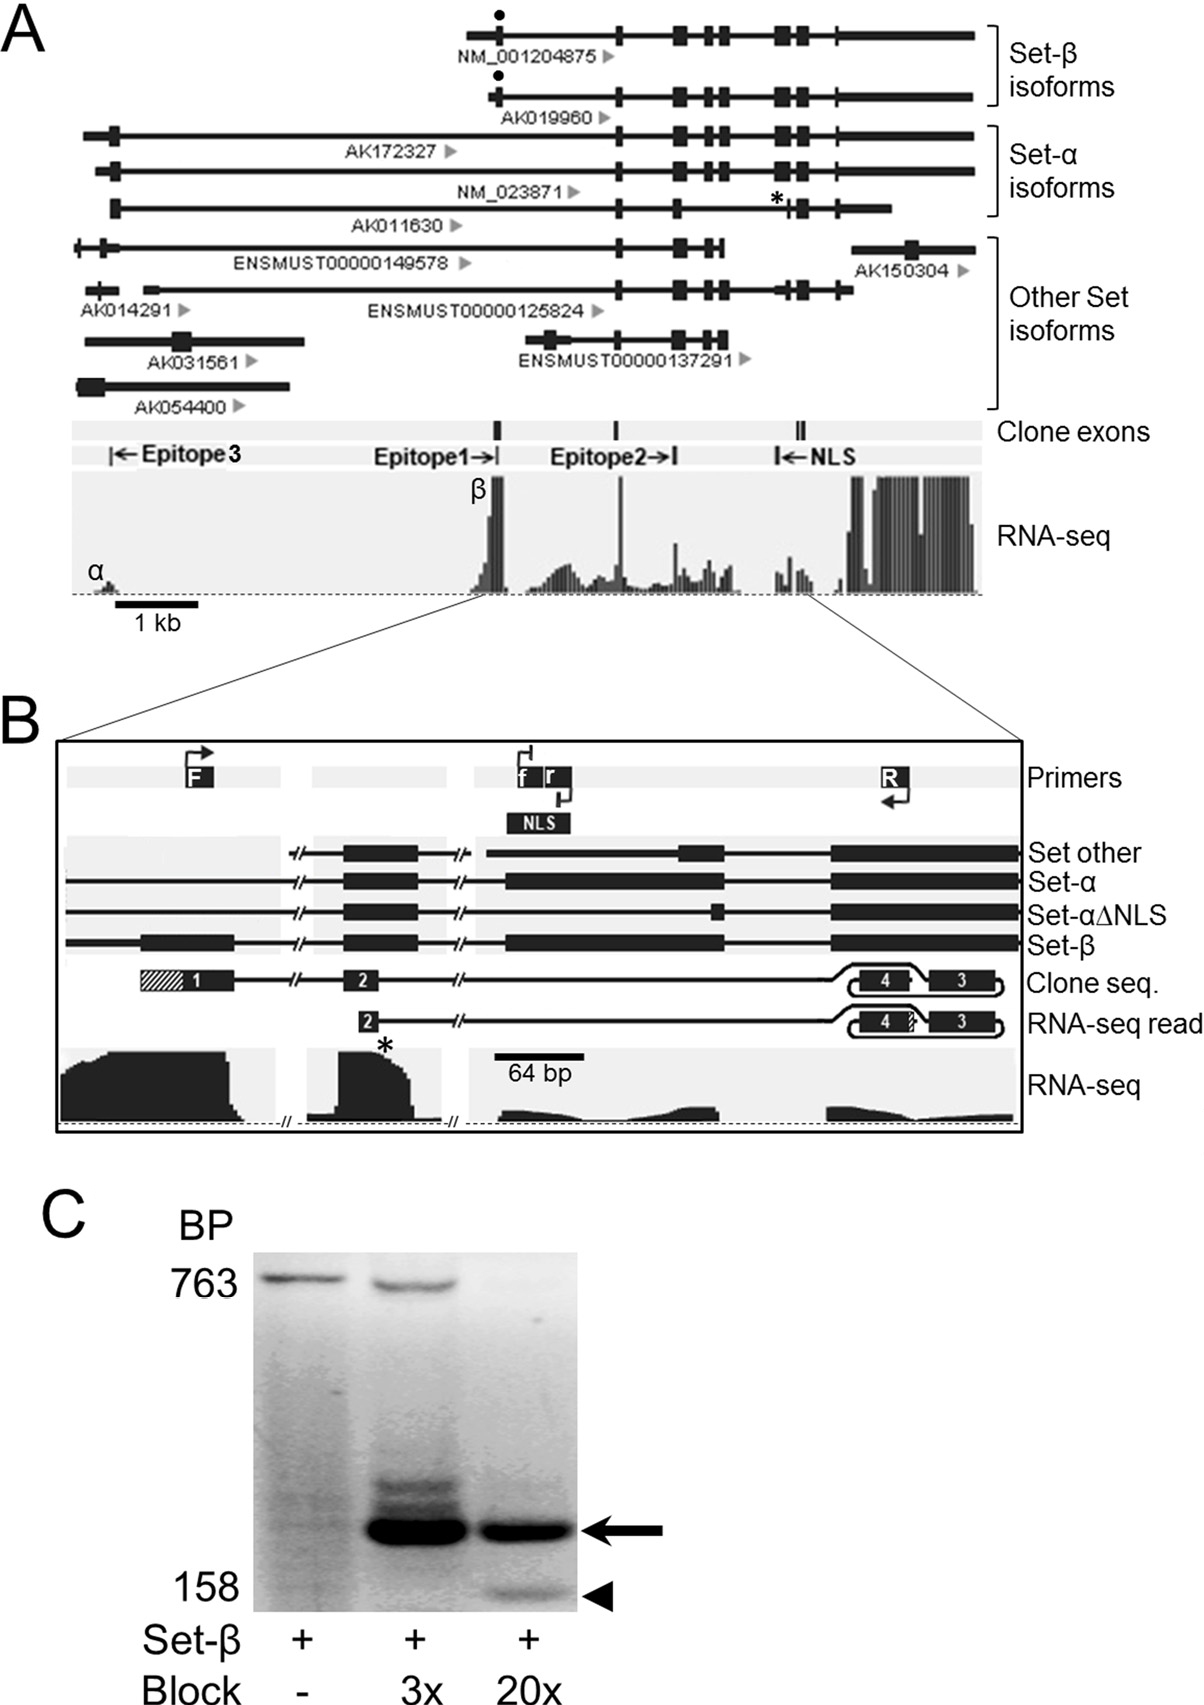
Novel neuronal alternatively spliced Set-β isoform lacking the nuclear localization signal. (A) Alternatively spliced Set isoforms from public databases aligned to genome; IDs indicated under the transcripts. NLS, nuclear localization signal; *, Set-α isoform lacking NLS sequence (Set-α∆NLS). PolyA-selected RNA-seq reads from purified RGCs, uniquely mapped to Set locus. Reads aligned to the Set-β-specific exon (β) showed significantly higher peak compared to the Set-α-specific exon (α). (B) Schematic of RT-PCR using a Set-β-specific forward primer (F), a reverse primer (R) from the exon past the NLS, and internally nested forward and reverse blocking primers against the NLS sequence modified at their 3’ ends to prevent PCR product elongation (f, r). RNA-seq read, 100% matching sequence identified in RNA-seq raw reads data; lined area at 3’ corresponds to 8 bp sequence past clone sequence, which also aligned 100% to the exon. (C) RT-PCR on RNA from purified RGCs showed increasing detection of a 158 bp product (arrowhead; diagrammed “clone seq” in panel b) over the 763 bp band corresponding to the full-length Set-β, at increasing concentrations of blocking primers 3x and 20x more than the Set-β primers. A higher molecular weight band (arrow) resulted from transcription initiated by the blocking primers (Trakhtenberg et al., 2015. Journal of Biological Chemistry).
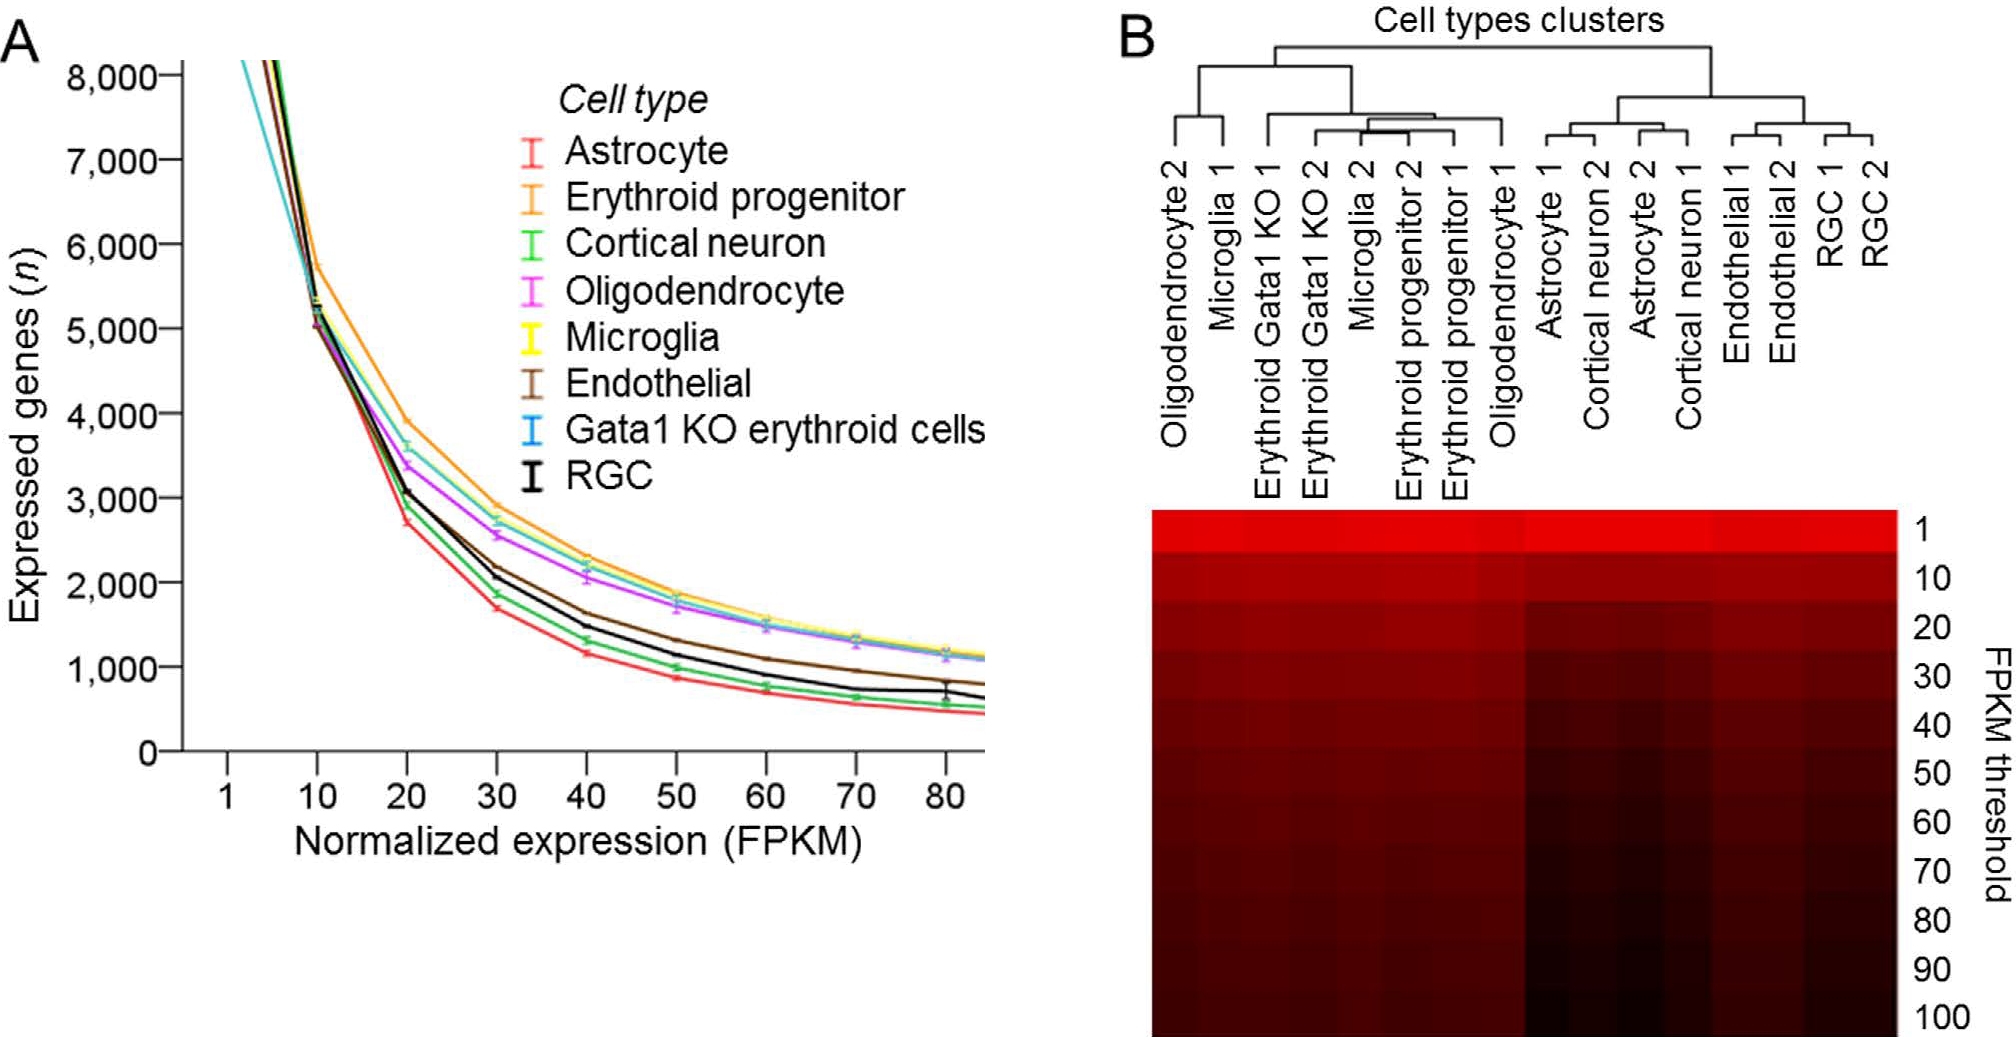
Various cell types analyzed with mRNA-seq differ in the proportion of highly expressed genes. (A) Number of expressed genes plotted across increasing normalized expression (FPKM) thresholds for different cell types, as marked (8 cell types, 2 replicates each, mean ± SEM shown; the mean FPKM values were statistically significantly different, p < 0.001, F = 63.2, by ANOVA with repeated measures, sphericity assumed). (B) Dendrogram of cell types segregated into two upper hierarchy clusters based on proportion of highly expressed genes, by hierarchical clustering analysis of number of expressed genes at increasing normalized expression (FPKM) thresholds for different cell types. Number of genes is color coded, ranging from high [red] to low [black] (Trakhtenberg et al., 2016. Scientific Reports).