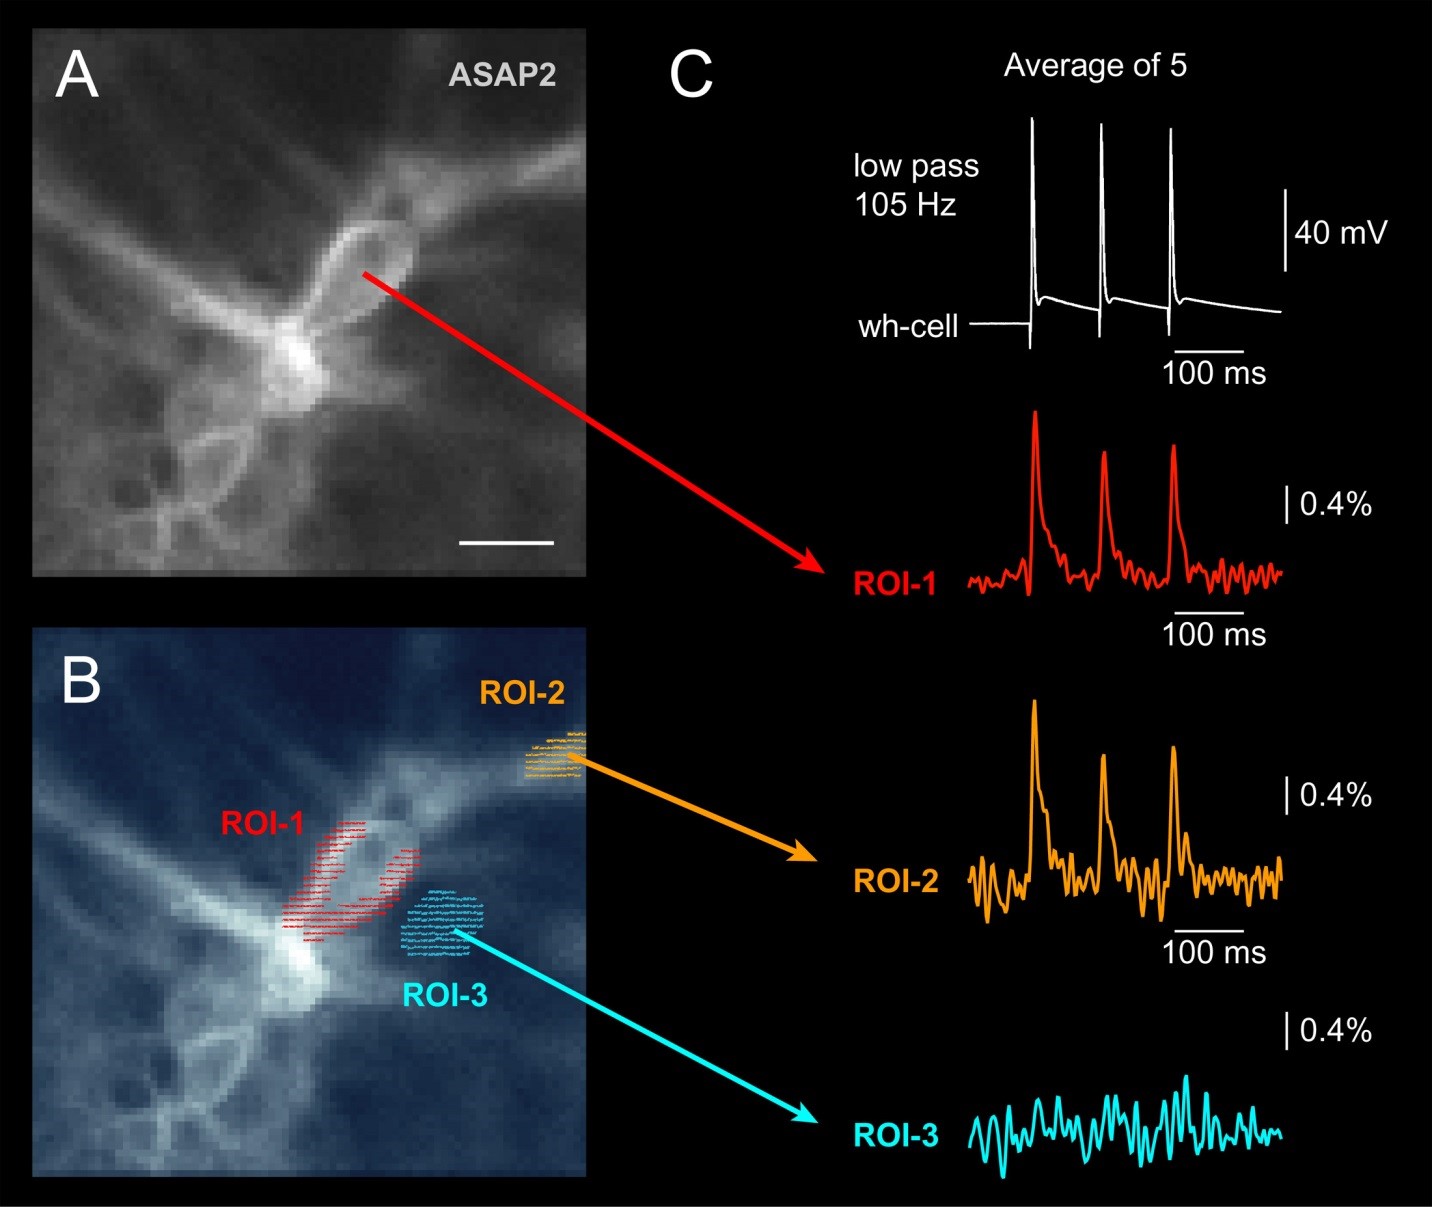
Voltage imaging using Genetically Encoded Voltage Indicator (GEVI). (A) Fluorescent GEVI probe “ASAP2” created by the MZ Lin Lab was expressed in mouse cultured neurons. Scale, 10 µm. (B) Three regions of interest (ROIs) are selected. Each pixel is shown as a little dash inside the ROI. (C) Three action potentials were evoked by direct current injection into the cell body. Simultaneous multisite GEVI voltage imaging from the cell body and neurites of the same neuron. Region of interest (ROI) #3 was used to test the spatial specificity (scattering) of the optical signal.
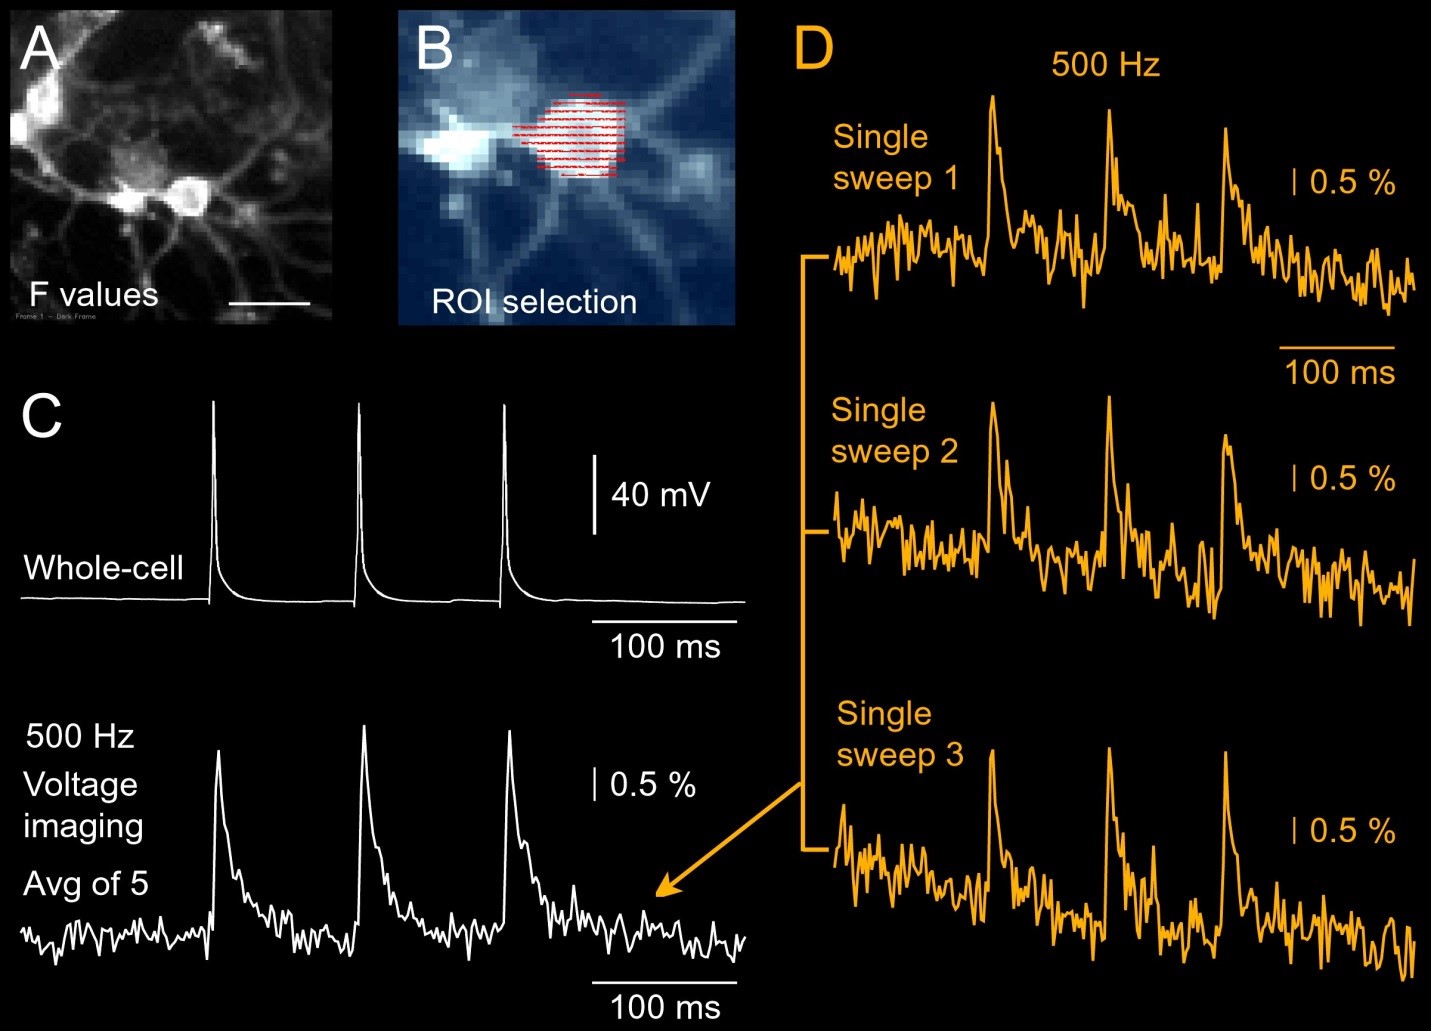
Voltage imaging using Genetically Encoded Voltage Indicator (GEVI). (A) Fluorescent GEVI probe “ASAP1” created by the MZ Lin Lab (Stanford) was packaged into an AAV vector by Mikhail Matlashov and Vlad Verkhusha (Albert Einstein College of Medicine), and expressed in mouse cultured neurons. Scale, 10 µm. Image was captured by camera used for infrared video microscopy during patching. (B) Image was captured by fast CCD camera used for voltage imaging. Each pixel is shown as a little dash inside the region of interest (ROI). (C) Three action potentials were evoked by direct current injection into the cell body. Top trace: Three APs recorded by patch electrode. Bottom trace: GEVI voltage imaging from the cell body. Five recording trials were averaged to obtain this optical signal. (D) Individual optical sweeps (trials) used in the averaging procedure to produce the optical trace in C.

GEVI voltage imaging in cultured mouse neurons. Neurons were transduced by AAV vectors carrying ASAP2 under the CaMKII promoter, ASAP2 under the hSyn promoter, or Bongwoori-Pos6 under the hSyn promoter. ASAP2 AVVs were kindly provided by the MZ Lin Lab. Bongwoori-Pos6 AAV was kindly provided by the BJ Baker Lab. White trace is whole-cell recording. Green traces are optical traces sampled at 500 Hz. Temporal averaging of 4 sweeps. Spatial averaging of ~15 pixels per ROI. No corrections were made for the background fluorescence.
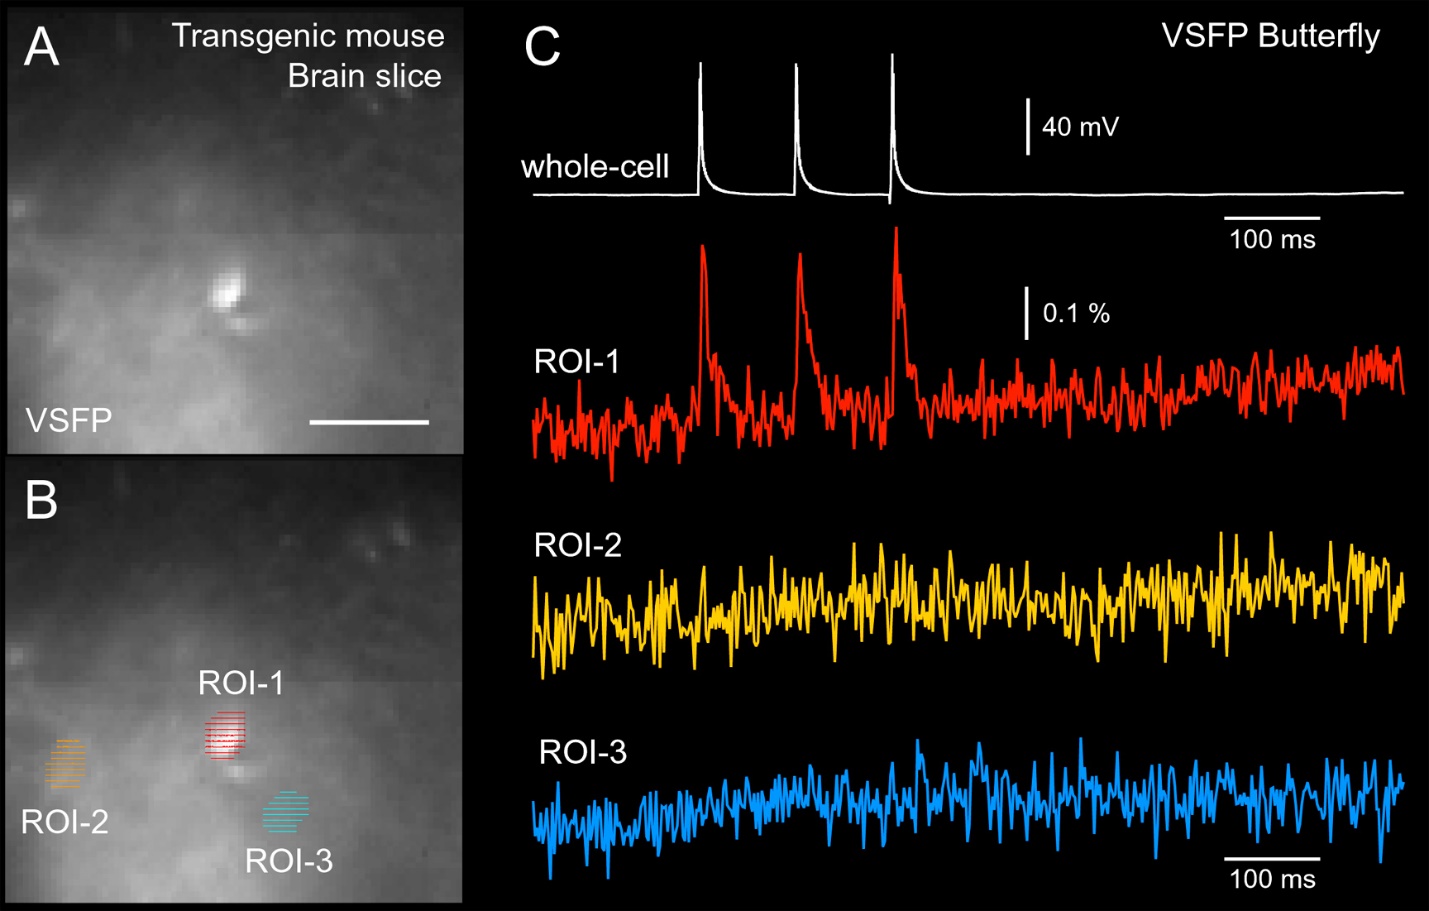
Voltage imaging in brain slices using Genetically Encoded Voltage Indicator (GEVI). Transgenic mouse line SPARSELY expressing a fluorescent GEVI probe “VSFP Butterfly” was created by the T. Knopfel Lab. Transgenic animals were transferred to the Antic Lab where voltage imaging was carried out. (A) Image of a brain slice from sparse GEVI mouse obtained at 500 Hz frame rate (80 x 80 pixels). Scale, 50 µm. (B) Three regions of interest (ROIs) are selected. Each pixel is shown as a little dash inside the ROI. (C) Three action potentials were evoked by direct current injection into the cell body. Simultaneous electrical recording from cell body (white) and optical recording from the cell body (red) and two regions in the background (ROI-2 and ROI-3). 500 Hz full frame rate; average of nine trials.
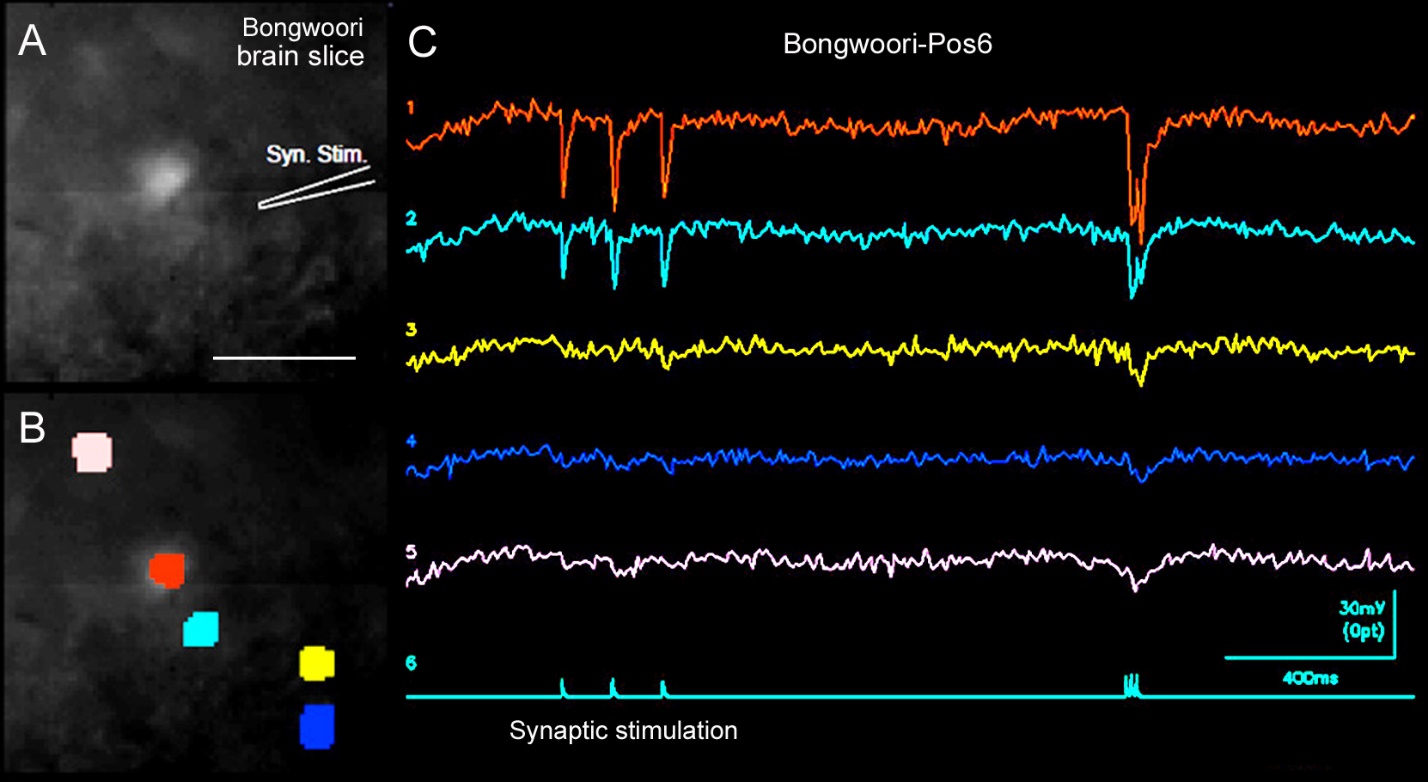
Voltage imaging in brain slices using Genetically Encoded Voltage Indicator (GEVI), Bongwoori-Pos6 created by the BJ Baker Lab. AAV1-hSyn-Bongwoori-Pos6, ICV Injection at P0. Brain slices prepared 31 days post injection. (A) One video frame sampled at 125 Hz. Scale, 50 µm. (B) Same as above with selection of 5 ROIs. (C) Synaptic stimulation comprised three stimuli at 105 ms interval, followed by 3 stimuli at 10 ms interval. Full frame sampled at 125 Hz. Temporal averaging of 4 sweeps. Spatial averaging of ~20 pixels per ROI. The Y-scale of the optical traces is a fractional change of the light intensity ΔF, expressed in mV (photocurrent-to-voltage converter).
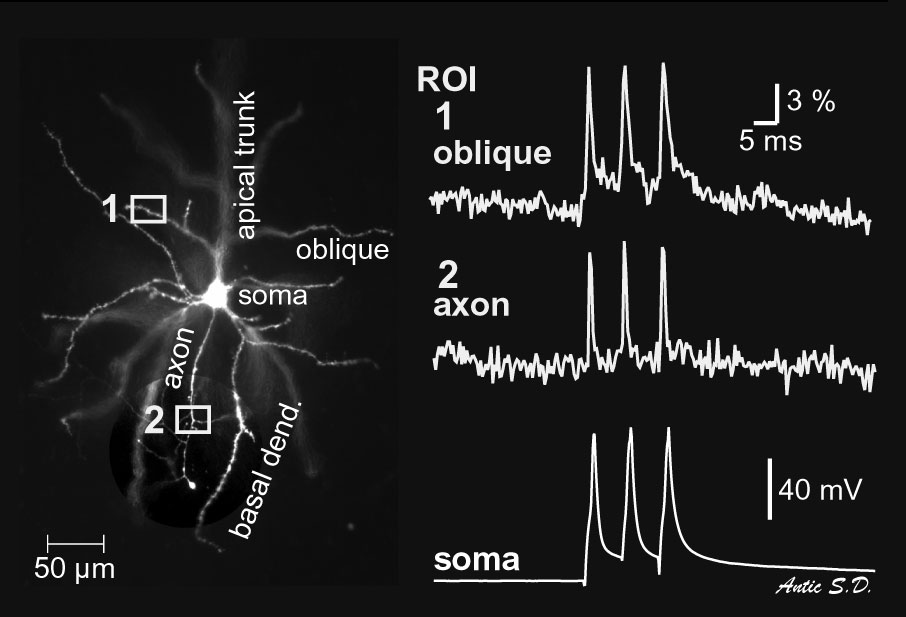
Voltage imaging from axon and oblique dendrite of the same cortical layer 5 pyramidal neuron. Three action potentials were evoked by direct current injection into the cell body. Note that AP duration in axon is notably shorter than in dendrite.
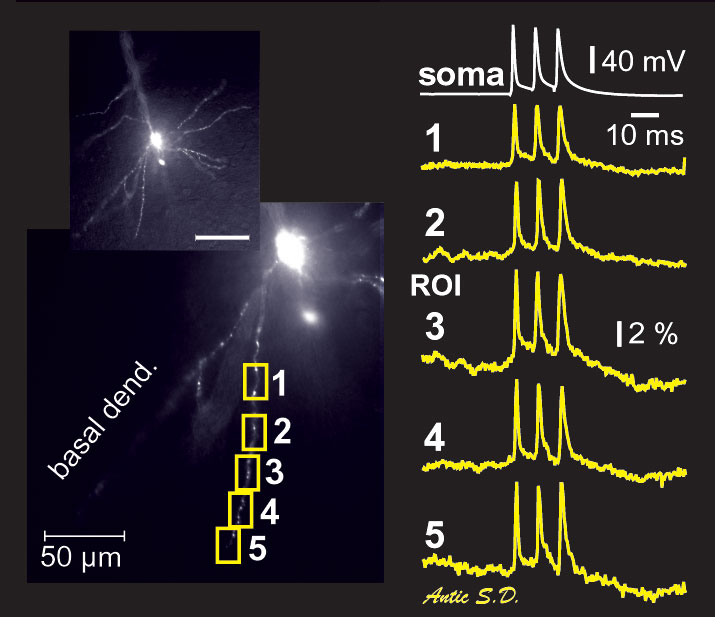
Simultaneous recording of action potential voltage waveforms along the basal dendrite of a cortical layer 5 pyramidal neuron. Three action potentials were evoked by direct current injection into the cell body.
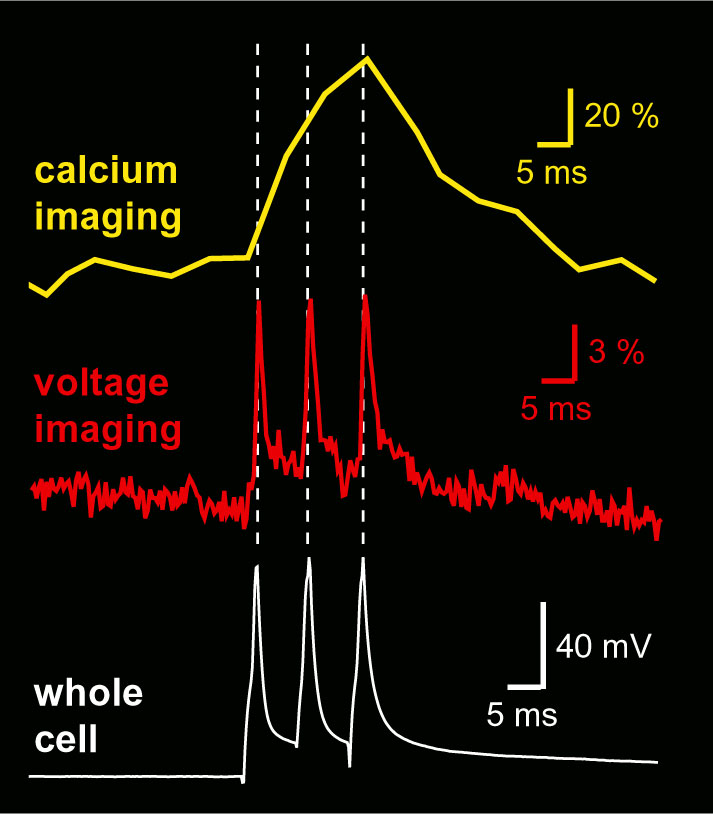
Sequential dendritic voltage imaging and dendritic calcium imaging from the same region of interest on a basal dendrite of layer 5 cortical pyramidal neuron. Three action potentials were evoked by direct current injection into the cell body. Voltage trace was sampled at 2,700 Hz rate, while the calcium signal was sampled with 500 Hz rate. Both voltage and calcium were recorded using the same camera (NeuroCCD, RedShirtImaging).
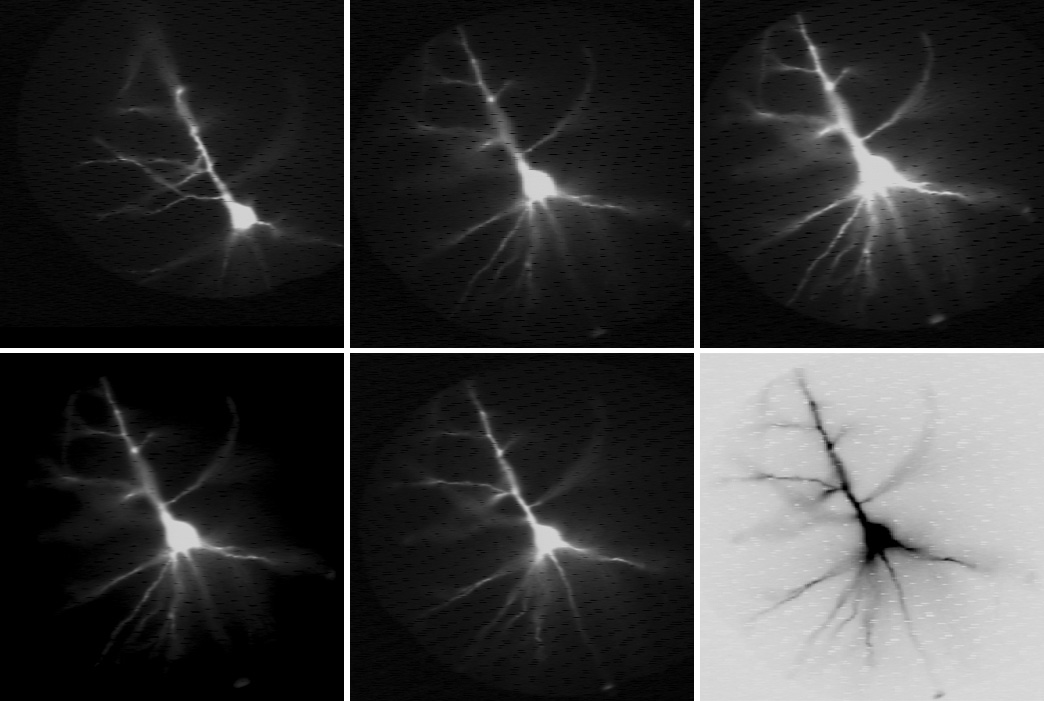
Fluorescent voltage-sensitive dye JPW-3028 was injected into layer V pyramidal neuron in the rat somatosensory cortex. Microphotographs capture the dendritic tree at different focal planes.

Same cell as above. The dendritic tree is now captured by the data acquisition camera during the actual voltage imaging sweep. Data acquisition camera is characterized by low resolution (80 x 80 pixels) but fast sampling rate (full frame per 0.37 milliseconds). The morphology of the living cell is projected onto the 80 x 80 array of optical detectors (pixels). By selecting a pixel from the array one can select the recording site. In this example, we chose one recording site near the soma (yellow), in the proximal basal dendrite (blue), in the distal basal dendrite (clay), at the oblique branch point (turquoise) and in the apical dendrite (red). Recordings are performed simultaneously from multiple locations, which provides a unique view in the signal initiation and propagation within the dendritic tree. Action potential was triggered in the cell body. Action potential-associated optical signals are captured from five regions of interest marked by colored pixels in the left image. Each signal is a spatial average of several pixels, and temporal average of four consecutive sweeps.