Track-A-Worm (version 2.0)
Version 2 now comprises three components: WormTracker, SleepTracker, and Action Potential Analyzer. The WormTracker is an update of the original Track-A-Worm, featuring substantial improvements in functionality. Below is a list of the major additions and enhancements:
- Option to differentiate between ventral and dorsal sides.
- Implementation of image recording in greatly reduced file sizes (approximately 16.0 KB at 100% camera resolution and 4.0 KB at 50% camera resolution), thereby conserving storage space and expediting subsequent analysis.
- Implementation of body curvature quantification.
- Capability to track and analyze worms on nematode culture plates with a layer of OP50 or other bacteria.
- Automatic spline fitting for virtually all worm shapes.
- Option to integrate external devices (e.g. a light source for optogenetic stimulation) through TTL signals.
- Plotting of forward and backward locomotion profiles.
- Resolution of a significant bug in the original version, with no other bugs identified in the current version.
System Setup Instructions
Please refer to the Setup Instructions.
Software Download
Standalone Version: Does not require a MATLAB license to run. Configured for "standard" hardware.
MATLAB-Dependent Version: Requires MATLAB installation on your computer. May be used to configure custom hardware.
Sample Recording
This sample recording (60 seconds) has a frame rate of 15 frames/second. The images were captured at 50% of the camera's resolution (4 KB/image). You can use this sample recording to evaluate WormTracker by installing the Standalone version on your computer (no additional hardware required).
Video tutorials
- Camera Calibration
- Record
- Playback
- Fit Spline
- Analyze
- Batch Spline
- Batch Analyze
- Curvature Analysis
- Sleep Recorder
- Sleep Analyzer
- Action Potential Analyzer
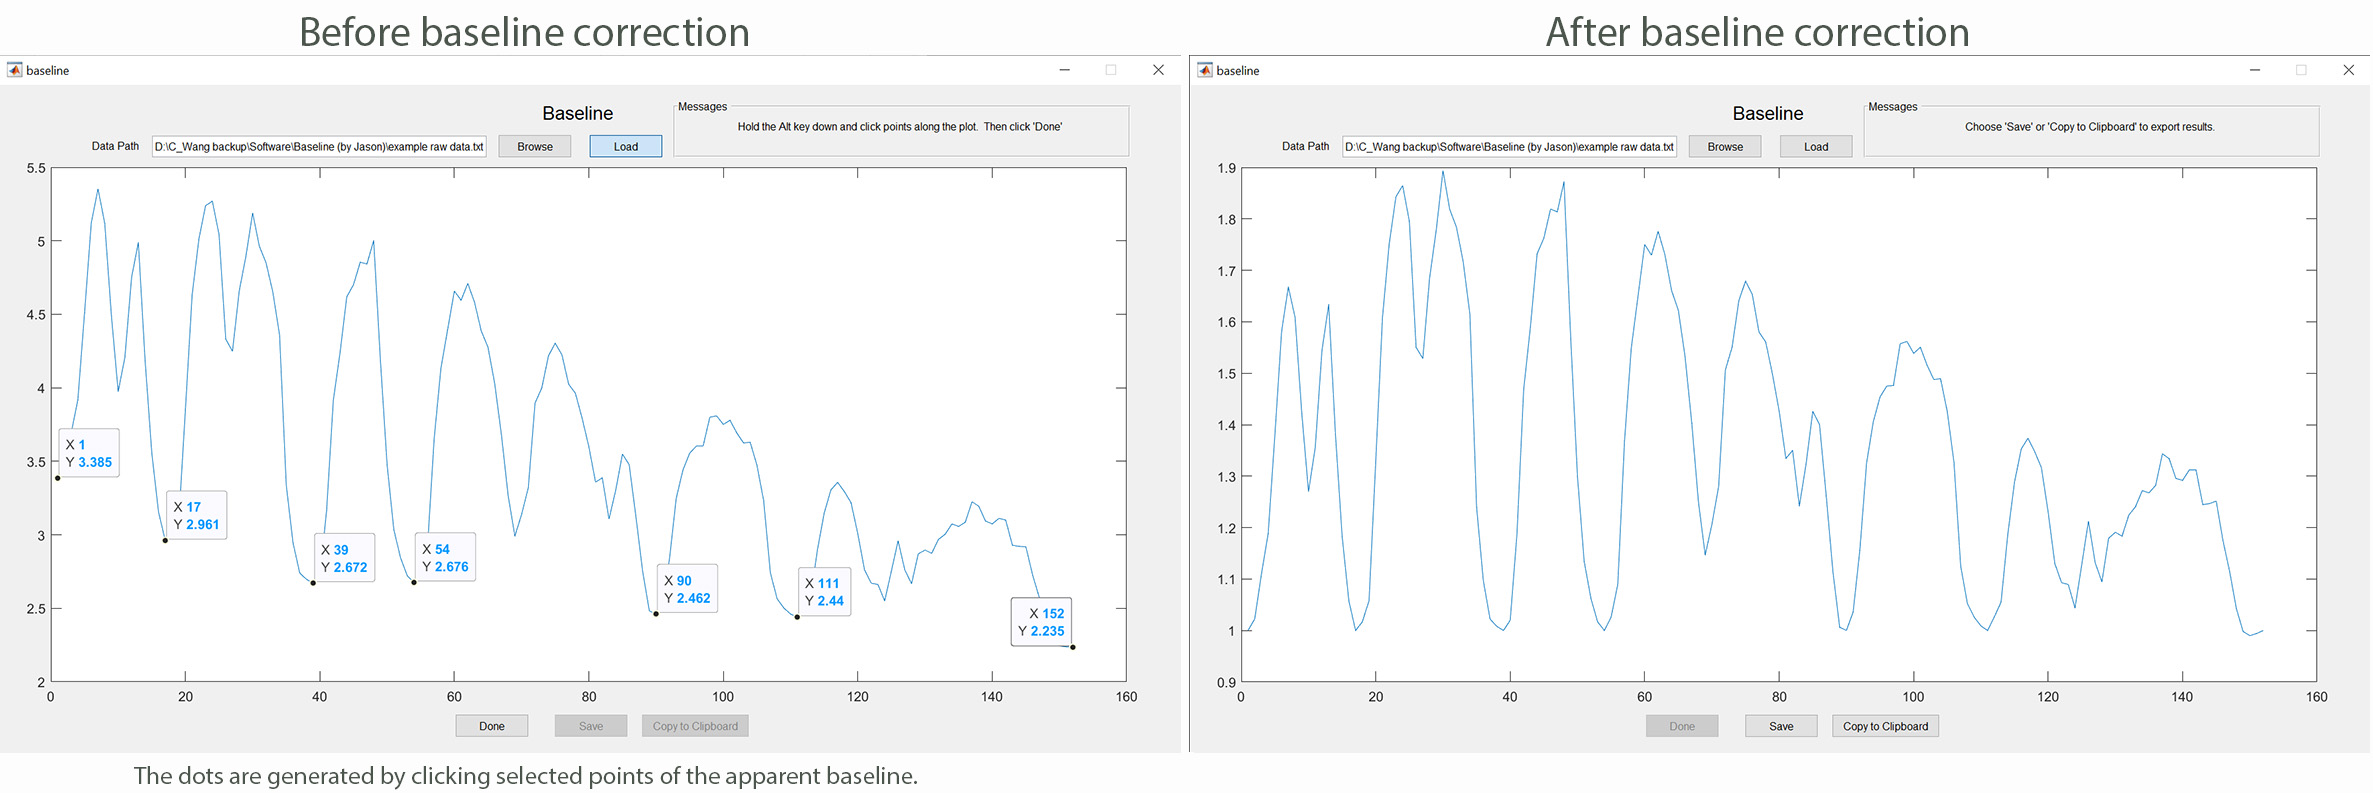
Baseline
This MATLAB-based app allows you to correct the drop in fluorescence signal over time due to photobleaching of a genetically encoded calcium sensor such as GCaMP6. The software uses the cubic interpolation algorithm to create a curve along the baseline chosen by the user. Subsequently, the raw data are divided by the interpolated points of the baseline to generate the normalized data. The software may be used by following these steps: 1) Assign regions of interest (ROIs) in your calcium imaging data using ImageJ (National Institute of Health); 2) plot fluorescence intensities (F) in each ROI as absolute intensities over time; 3) save only the fluorescence intensities as a text file; 4) run the app by clicking the "baseline.m" file; 5) load the text file into the app to produce a trace of the raw data; 6) click baseline points along the plot while holding down the "Alt" key, followed by clicking "Done"; 7) Click "Yes" if the spline (red color) generated by the app represents the baseline well; 8) save the data (F/F0). Click baseline to download the app.